Options flow, right on the chart.
Switch on Option flow and the big call and put trades land on the candles they hit, sweeps marked. See where premium is going without leaving the chart. Free.
No card needed. The flow overlay is free for US stocks and ETFs.
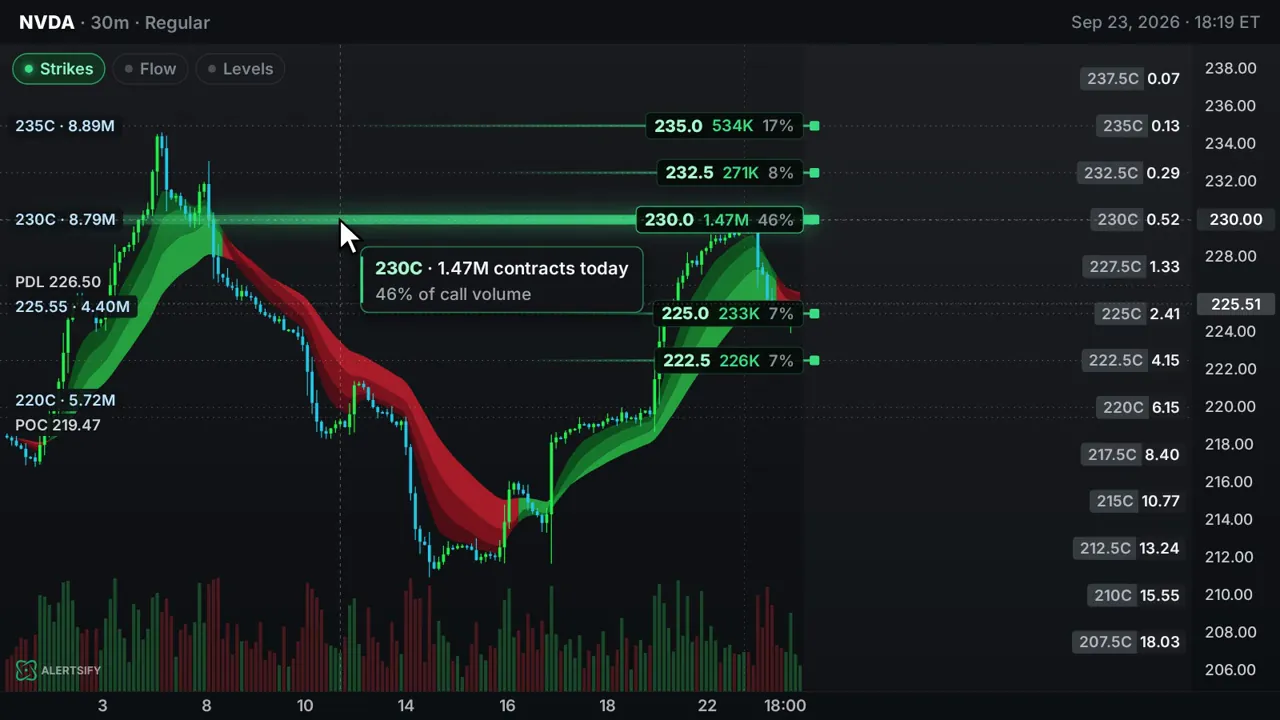
Strikes and flow on an Alertsify chart: contracts traded at each strike, 46% of call volume at 230C. Illustrative example, not a real trade.
Big trades, where they happened.
Each bubble is a large options trade on the stock you're charting, placed on the bar it traded in.
Flow, gamma and dark pool together.
Turn on Gamma walls and Dark pool from the same menu and read all three on one chart.
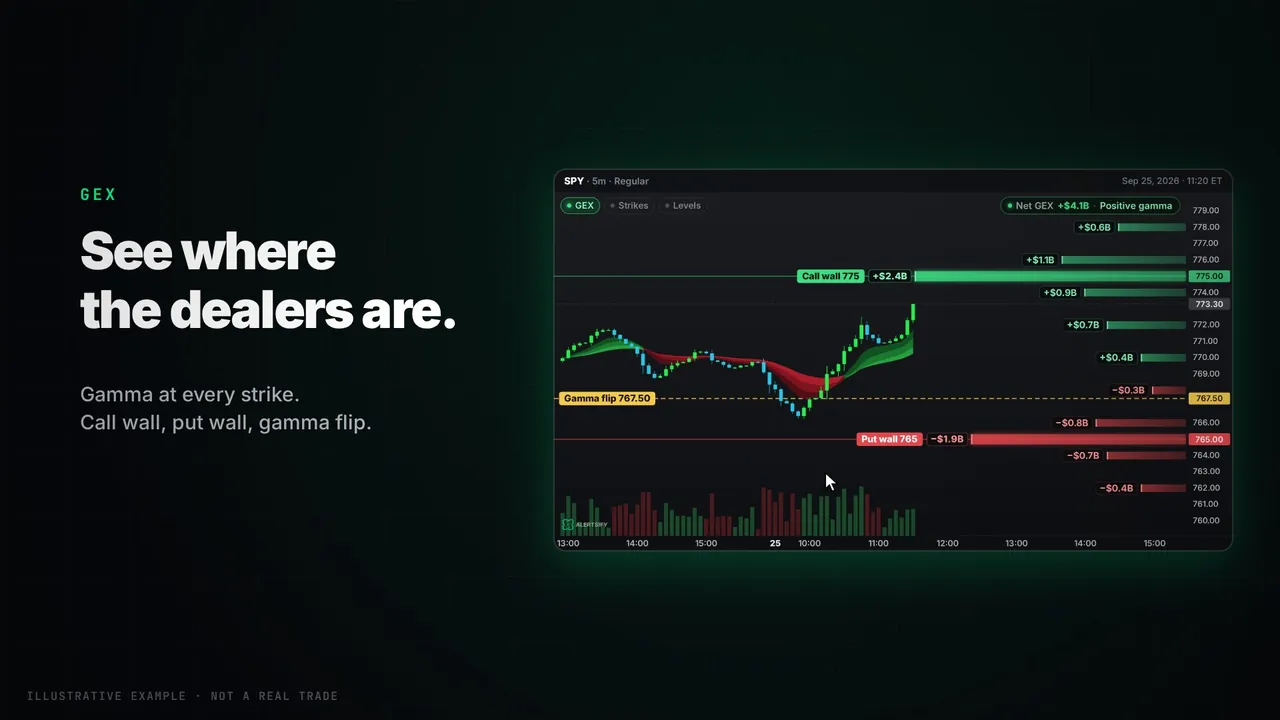
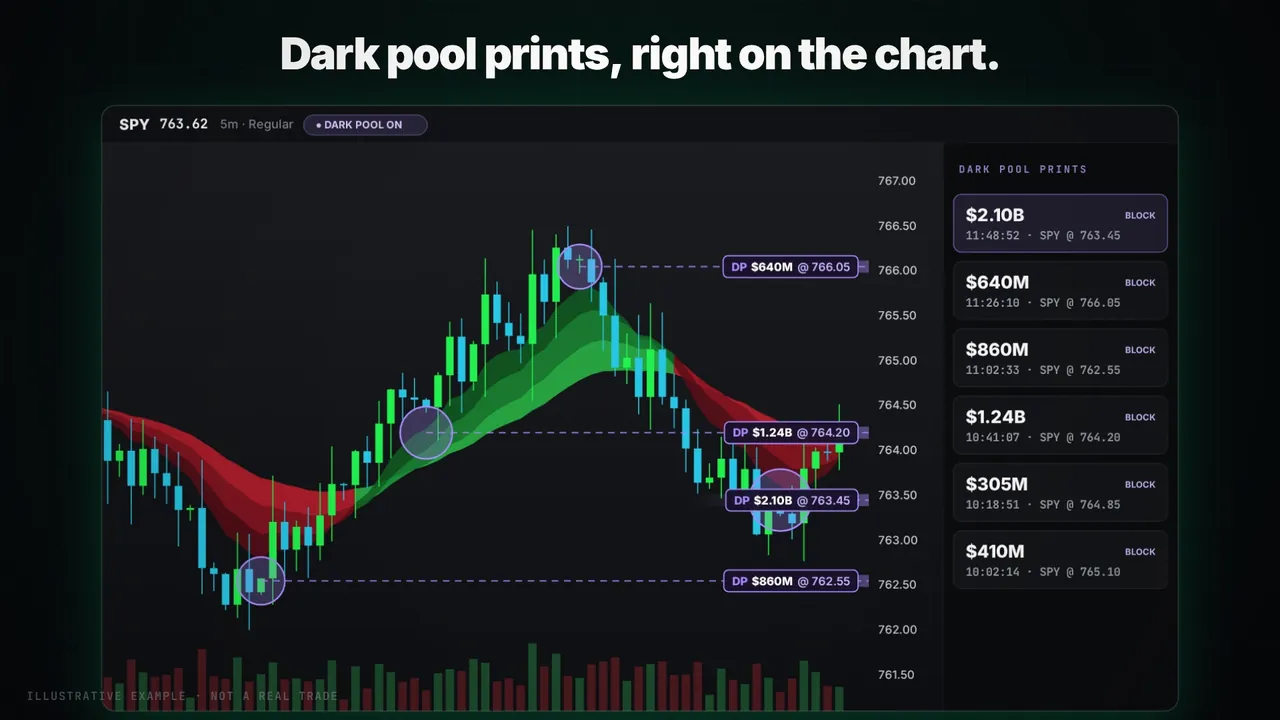
Illustrative examples, not real trades.
The free chart shows flow as an overlay on the chart. The full flow tape, with every print and its filters, isn't part of the free account.
Options flow on Alertsify.
Is options flow on the chart free?
Yes. The Option flow overlay is part of the free account for US stocks and ETFs. No card needed.
What do the colours mean?
Cyan bubbles are big call trades and violet bubbles are big puts. A white ring means a sweep, and a bigger bubble means more premium.
How do I turn it on?
Open Levels on the chart toolbar, or Chart settings on a phone, and switch on Option flow.
Does flow tell me which way a stock will move?
No. A single trade can open or close a position, so flow shows where money traded, not what comes next. Use it as one input among others.
Is the full flow tape included?
Not on the free account. The free chart shows big trades as an overlay on the chart.
See the flow on your chart.
Free account. No card needed.
Options flow shows trades that happened, not advice or a prediction. Chart examples are illustrative, not real trades. Trading options involves substantial risk of loss. Alertsify is a self-directed software tool and is not a registered investment adviser or broker-dealer. All trading involves risk.